D3.js - 工作例項
讓我們在本章中執行動畫條形圖。對於此示例,我們將人口記錄的前一章中使用的 data.csv 檔案作為資料集並生成動畫條形圖。
為此,我們需要執行以下步驟 -
步驟 1 - 應用樣式 - 使用下面給出的編碼應用 CSS 樣式。
<style>
   .bar {
      fill: green;
   }

   .highlight {
      fill: red;
   }

   .title {
      fill: blue;
      font-weight: bold;
   }
</style>
步驟 2 - 定義變數 - 讓我們使用下面的指令碼定義 SVG 屬性。
<script>
   var svg = d3.select("svg"), margin = 200,
   width = svg.attr("width") - margin,
   height = svg.attr("height") - margin;
</script>
步驟 3 - 附加文字 - 現在,附加文字並使用下面的編碼應用轉換。
svg.append("text")
   .attr("transform", "translate(100,0)")
   .attr("x", 50)
   .attr("y", 50)
   .attr("font-size", "20px")
   .attr("class", "title")
   .text("Population bar chart")
步驟 4 - 建立比例範圍 - 在此步驟中,我們可以建立比例範圍並附加組元素。它定義如下。
var x = d3.scaleBand().range([0, width]).padding(0.4),
   y = d3.scaleLinear()
      .range([height, 0]);
   var g = svg.append("g")
      .attr("transform", "translate(" + 100 + "," + 100 + ")");
步驟 5 - 讀取資料 - 我們已在前面的示例中建立了 data.csv 檔案。我們在這裡使用過相同的檔案。
year,population
2006,40
2008,45
2010,48
2012,51
2014,53
2016,57
2017,62
現在,使用下面的程式碼閱讀上述檔案。
d3.csv("data.csv", function(error, data) {
   if (error) {
      throw error;
   }
步驟 6 - 設定域 - 現在,使用下面的編碼設定域。
x.domain(data.map(function(d) { return d.year; }));
y.domain([0, d3.max(data, function(d) { return d.population; })]);
步驟 7 - 新增 X 軸 - 現在,你可以將 X 軸新增到轉換中。如下所示。
g.append("g")
   .attr("transform", "translate(0," + height + ")")
   .call(d3.axisBottom(x)).append("text")
   .attr("y", height - 250).attr("x", width - 100)
   .attr("text-anchor", "end").attr("font-size", "18px")
   .attr("stroke", "blue").text("year");
步驟 8 - 新增 Y 軸 - 使用下面給出的程式碼將 Y 軸新增到變換中。
g.append("g")
   .append("text").attr("transform", "rotate(-90)")
   .attr("y", 6).attr("dy", "-5.1em")
   .attr("text-anchor", "end").attr("font-size", "18px")
   .attr("stroke", "blue").text("population");
步驟 9 - 追加組元素 - 現在,追加組元素並將變換應用於 Y 軸,如下所述。
g.append("g")
   .attr("transform", "translate(0, 0)")
   .call(d3.axisLeft(y))
步驟 10 - 選擇條形類 - 現在,選擇條形類中的所有元素,如下所述。
g.selectAll(".bar")
   .data(data).enter()
   .append("rect")
   .attr("class", "bar")
   .on("mouseover", onMouseOver)
   .on("mouseout", onMouseOut)
   .attr("x", function(d) { return x(d.year); })
   .attr("y", function(d) { return y(d.population); })
   .attr("width", x.bandwidth())
   .transition()
   .ease(d3.easeLinear)
   .duration(200)
   .delay(function (d, i) {
      return i * 25;
   })
   .attr("height", function(d) { return height - y(d.population); });
});
在這裡,我們為 mouseout 和 mouseover 新增了 listener 事件以執行動畫。當滑鼠懸停在特定條上並離開時,它會應用動畫。這些功能將在以下步驟中說明。
所述 .ease(d3.easeLinear) 函式用於在動畫執行視在運動。它以 200 的持續時間處理慢進和慢進運動。可以使用以下方法計算延遲:
.delay(function (d, i) {
   return i * 25;
})
步驟 11 - 滑鼠懸停事件處理函式 - 讓我們建立一個滑鼠懸停事件處理程式來處理滑鼠事件,如下所示。
function onMouseOver(d, i) {
   d3.select(this)
      .attr('class', 'highlight');
   d3.select(this)
      .transition()
      .duration(200)
      .attr('width', x.bandwidth() + 5)
      .attr("y", function(d) { return y(d.population) - 10; })
      .attr("height", function(d) { return height - y(d.population) + 10; });
   g.append("text")
      .attr('class', 'val')

   .attr('x', function() {
      return x(d.year);
   })

   .attr('y', function() {
      return y(d.value) - 10;
   })
}
這裡,在 mouseover 事件中,我們希望將條形寬度和高度以及所選條形的條形顏色增加為紅色。對於顏色,我們新增了一個“突出顯示”類,它將所選欄的顏色更改為紅色。
到條的轉換函式持續 200 毫秒。當我們將條的寬度增加 5px,高度增加 10px 時,從條的前一個寬度和高度到新的寬度和高度的過渡將持續 200 毫秒。
接下來,我們向條形計算了一個新的 y 值,以便條形不會因新的高度值而扭曲。
步驟 12 - Mouseout 事件處理函式 - 讓我們建立一個 mouseout 事件處理程式來處理滑鼠事件。它定義如下。
function onMouseOut(d, i) {
   d3.select(this).attr('class', 'bar');

   d3.select(this)
      .transition()
      .duration(400).attr('width', x.bandwidth())
      .attr("y", function(d) { return y(d.population); })
      .attr("height", function(d) { return height - y(d.population); });

   d3.selectAll('.val')
      .remove()
}
這裡,在 mouseout 事件中,我們想要刪除我們在 mouseover 事件中應用的選擇功能。因此,我們將 bar 類還原為原始的 bar 類,並恢復所選條形的原始寬度和高度,並將 y 值恢復為原始值。
該 d3.selectAll(“ VAL”)。remove() 方法函式用於刪除我們酒吧的選擇過程中又增加了文字值。
步驟 13 - 工作示例 - 完整程式在以下程式碼塊中給出。建立一個網頁 animated_bar.html 並向其新增以下更改。
<!DOCTYPE html>
<html>
   <head>
      <style>
         .bar {
            fill: green;
         }

         .highlight {
            fill: red;
         }

         .title {
            fill: blue;
            font-weight: bold;
         }
      </style>
      <script src = "https://d3js.org/d3.v4.min.js"></script>
      <title> Animated bar chart </title>
   </head>

   <body>
      <svg width = "500" height = "500"></svg>
      <script>
         var svg = d3.select("svg"),
         margin = 200, width = svg.attr("width") - margin,
         height = svg.attr("height") - margin;

         svg.append("text")
            .attr("transform", "translate(100,0)")
            .attr("x", 50).attr("y", 50)
            .attr("font-size", "20px")
            .attr("class", "title")
            .text("Population bar chart")

         var x = d3.scaleBand().range([0, width]).padding(0.4),
         y = d3.scaleLinear().range([height, 0]);

         var g = svg.append("g")
            .attr("transform", "translate(" + 100 + "," + 100 + ")");

         d3.csv("data.csv", function(error, data) {
            if (error) {
               throw error;
            }

            x.domain(data.map(function(d) { return d.year; }));
            y.domain([0, d3.max(data, function(d) { return d.population; })]);

            g.append("g")
               .attr("transform", "translate(0," + height + ")")
               .call(d3.axisBottom(x))
               .append("text")
               .attr("y", height - 250)
               .attr("x", width - 100)
               .attr("text-anchor", "end")
               .attr("font-size", "18px")
               .attr("stroke", "blue").text("year");

            g.append("g")
               .append("text")
               .attr("transform", "rotate(-90)")
               .attr("y", 6)
               .attr("dy", "-5.1em")
               .attr("text-anchor", "end")
               .attr("font-size", "18px")
               .attr("stroke", "blue")
               .text("population");

            g.append("g")
               .attr("transform", "translate(0, 0)")
               .call(d3.axisLeft(y))

            g.selectAll(".bar")
               .data(data)
               .enter()
               .append("rect")
               .attr("class", "bar")
               .on("mouseover", onMouseOver)
               .on("mouseout", onMouseOut)
               .attr("x", function(d) { return x(d.year); })
               .attr("y", function(d) { return y(d.population); })
               .attr("width", x.bandwidth()).transition()
               .ease(d3.easeLinear).duration(200)
               .delay(function (d, i) {
                  return i * 25;
               })

            .attr("height", function(d) { return height - y(d.population); });
         });


         function onMouseOver(d, i) {
            d3.select(this)
            .attr('class', 'highlight');

            d3.select(this)
               .transition()
               .duration(200)
               .attr('width', x.bandwidth() + 5)
               .attr("y", function(d) { return y(d.population) - 10; })
               .attr("height", function(d) { return height - y(d.population) + 10; });

            g.append("text")
               .attr('class', 'val')
               .attr('x', function() {
                  return x(d.year);
               })

            .attr('y', function() {
               return y(d.value) - 10;
            })
         }

         function onMouseOut(d, i) {

            d3.select(this)
               .attr('class', 'bar');

            d3.select(this)
               .transition()
               .duration(200)
               .attr('width', x.bandwidth())
               .attr("y", function(d) { return y(d.population); })
               .attr("height", function(d) { return height - y(d.population); });

            d3.selectAll('.val')
               .remove()
         }
      </script>
   </body>
</html>
現在,請求瀏覽器,我們將看到以下響應。
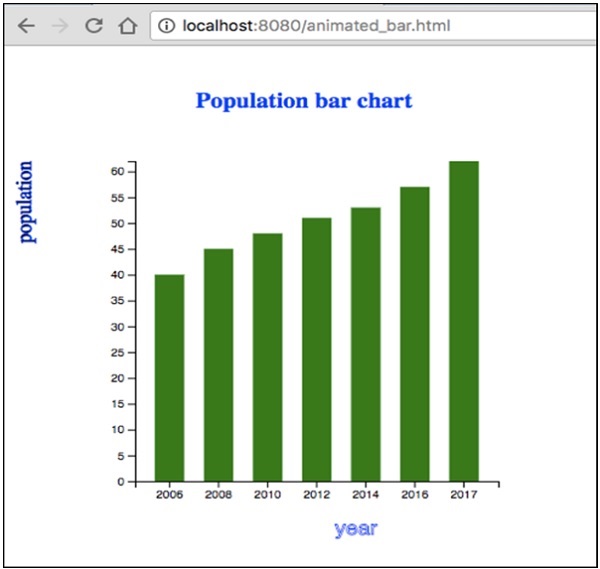
如果我們選擇任何條形圖,它將以紅色突出顯示。D3 是一個通用的視覺化庫,用於處理資料到資訊,文件,元素等的轉換,最終有助於建立資料視覺化。